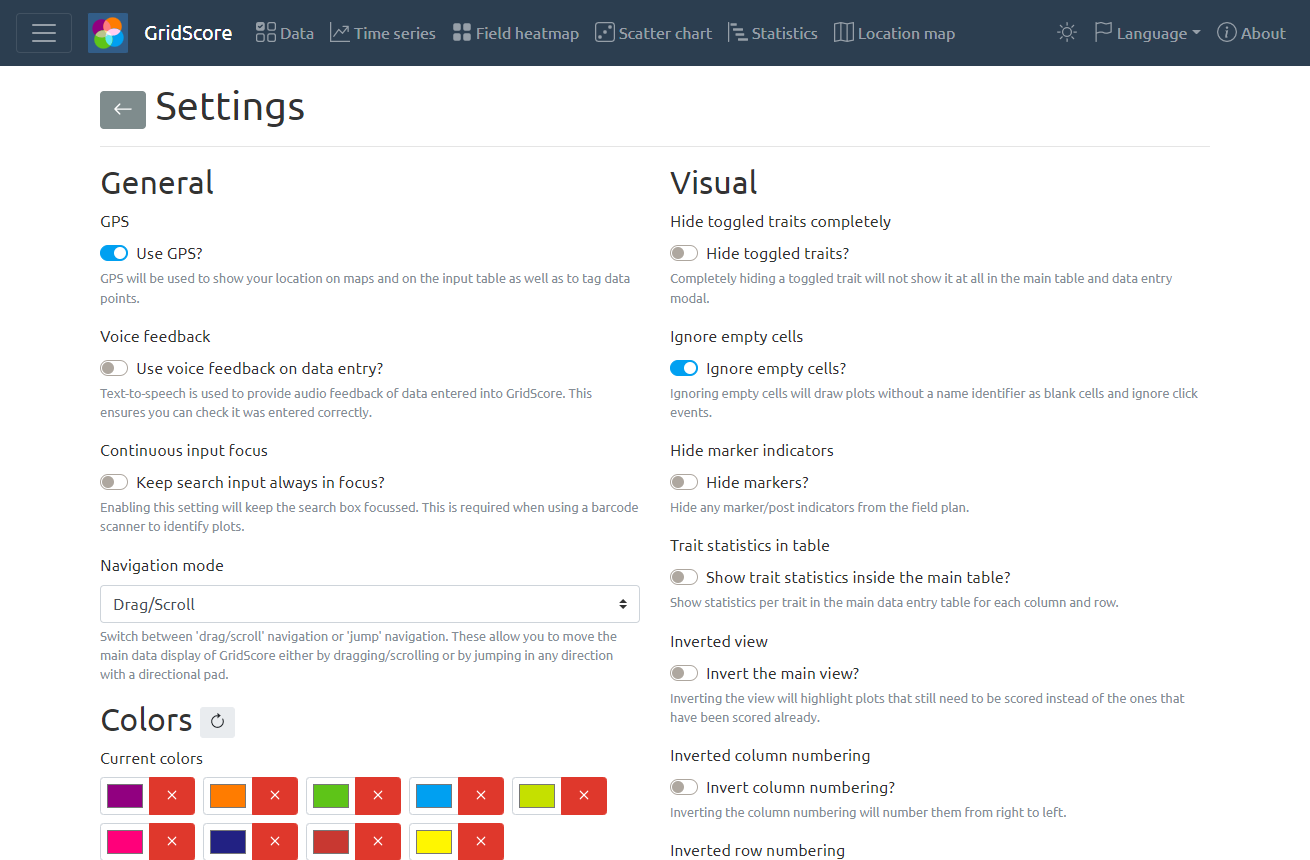
Settings
GridScore comes with many customization options, grouped into subsections. Save your changes at the bottom of the screen or click on the back arrow in the top left when you’re done.
General
GPS
GridScore uses your device’s GPS information for multiple reasons:
- Tag photos with your GPS coordinates.
- Tag data points with the GPS coordinates where they have been recorded.
- If the trial corner points have been defined, GridScore will show your current position within the trial on the data screen.
You can disable this option if you do now want GridScore to use your GPS location.
Voice feedback
Most mobile devices offer support for text-to-speech (TTS) synthesis. GridScore can make use of this by using TTS as an audio feedback mechanism. This helps users verify that the data they entered is correct.
Continuous input focus
GridScore supports selecting a plant/plot by scanning a representative barcode. This is done by utilizing the search box in the top right of the data view. Most external barcode scanners identify themselves as keyboards to mobile devices. As such, the search box needs to have focus for the input sent from the barcode scanner to appear here. When selecting this option, GridScore will periodically force the focus back onto the search box to ensure that any input sent from a barcode scanner ends up in the search box.
If you are not using a barcode scanner, leave this option disabled.
Navigation mode
By default, you will be able to navigate the main data view of GridScore by scrolling/panning the view either with a mouse/touchpad or a touchscreen.
This mode (called Drag/scroll) gives you the most flexibility when exploring the field plan. However, in this mode it’s quite easy to scroll the view accidentally. The Jump mode helps with this situation by disabling scrolling/panning and instead offering a dedicated button that shows a directional pad which is used to move the view into one of 8 directions, one plant/plot at a time.
In addition to helping prevent accidental navigation, the Jump mode is also recommended to be used on older devices with poor performance on the Drag/scroll mode as it drastically reduces the number of times the view has to be re-rendered.
Colors
GridScore is a very visual tool. It uses colors to represent traits and whether the information for a certain trait has been scored or not. By default, we chose a color scheme that shows good performance on color-blind safety checks as well as being aesthetically pleasing. The color palette can be changed by adding and removing colors.
Visual
Hide toggled traits completely (default: false)
To declutter the data view of GridScore, users can toggle the visibility of traits to only show those they are interested in. By default, GridScore will grey-out the disabled trait circles, but they are still visible. Enabling this setting will completely hide toggled traits until they are made visible again. This can massively reduce the number of visible trait circles on the main view.
Ignore empty cells (default: true)
Not every trial layout is perfectly rectangular. Sometimes a corner is missing or there is a huge rock in the middle of the field. To accommodate this, you can leave cells blank in the trial setup stage. By default, GridScore will assume these cells should not be scored and will show them as completely blank on the data view. Interacting with these cells by clicking will have no effect.
If this setting is disabled, GridScore will show the plant/plot as N/A and allow scoring this cell.
Hide marker indicators (default: false)
During setup, it’s possible to define visual markers/posts as part of the trial layout. These usually help with orientation in the trial and GridScore will show these on the main data view as grey circles. Users can decide to hide these markers by disabling this option.
Trait statistics in table (default: false)
GridScore shows the progress of scoring per trait in the trait visibility dropdown in the form of a progress bar. Similarly, when enabling this options, GridScore can show the progress per row and column of the field plan in the row and column headers in the form of bar charts.
Inverted view (default: false)
The main data view of GridScore shows traits that haven’t been scored yet in the form of a circle outline and scored traits in the form of filled circles. At the start of a trial, most circles will be empty and it’s therefore easy to identify which plants/plots still need to be scored. Towards the end of the trial, most plants/plots will have been scored for most traits and it will be more difficult to identify the cells that require scoring. By enabling this option, GridScore can invert the main view and show unscored traits as filled circles, which makes them immediately more visible.
Inverted column numbering (default: false)
By default, GridScore will number columns from left to right, i.e. the first column has number 1, then 2 and so on. In some scenarios, it may be necessary to invert this numbering so that the rightmost column has the number 1 and the one to the left 2 and so on. Enable this setting to achieve this.
Inverted row numbering (default: false)
Same as Invert column numbering just for rows.
Min. column width (default: 120)
GridScore will try to display as much of your field plan on screen as possible. The height of a cell is automatically calculated to ensure the germplasm/variety name as well as the trait circles are visible. The width of a cell, however, can sometimes end up being very narrow. If you have long germplasm/variety identifiers, it may be necessary to increase the width of the cells. Set this value to the number of pixels you would like each column to be.
Advanced
Under normal operation, you should never have to use the advanced settings. However, it may happen that GridScore, for whatever reason, stops working correctly. To get GridScore back into a state where it will function as expected you can reset GridScore completely. This will, however, delete any data and settings, so be sure this is what you want to do.