Collecting Data
Once your trial is set up, it’s time to collect some data. Select your dataset from the home screen or the side menu.
Field plan
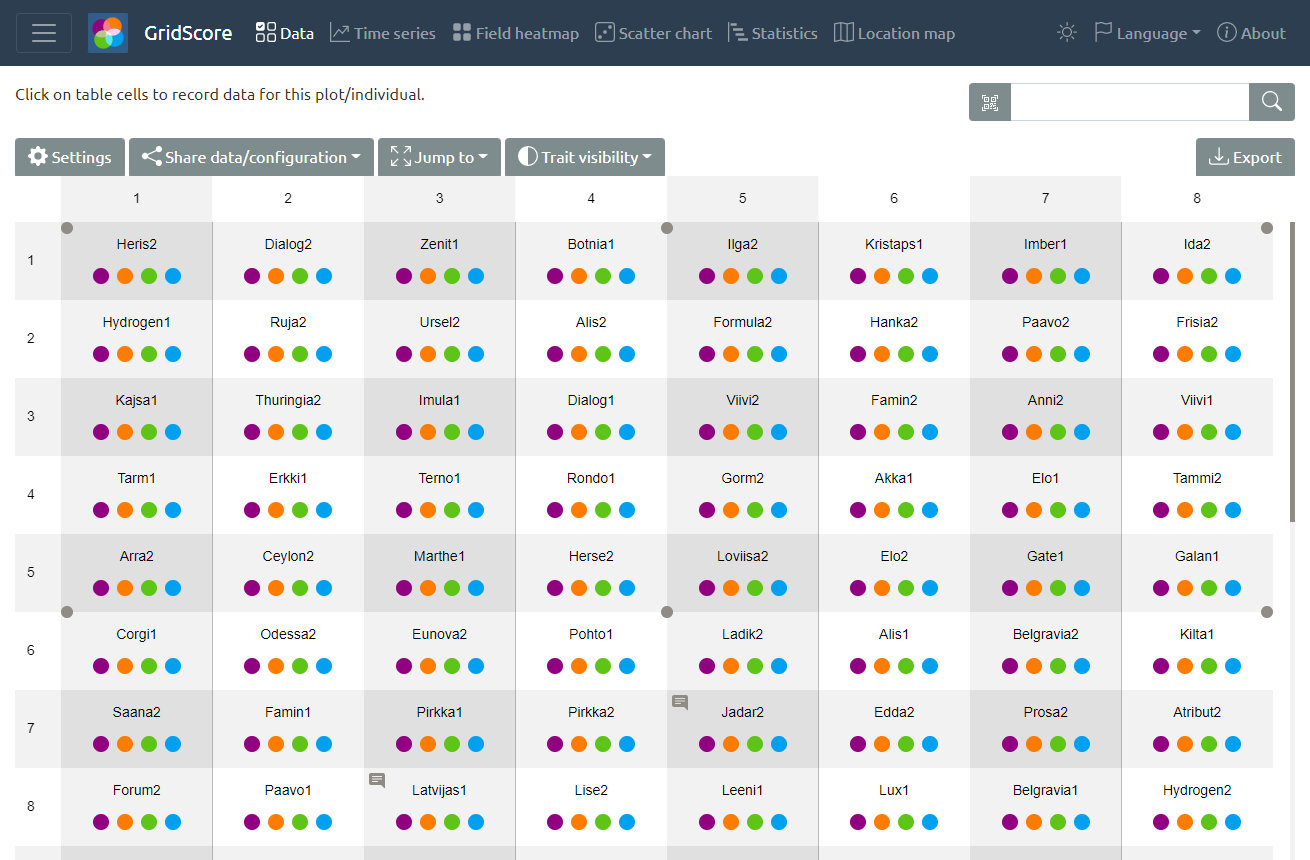
The main data view represents your field plan with rows and columns. Each cell is a plant/plot and shows you a short version of the germplasm/variety name. The coloured dots in each cell represent the traits that have been defined and whether the respective trait has already been scored or not. Filled circles represent a scored trait while outlined circles indicate that this trait still needs to be scored. This is especially useful when scoring time-based traits like emergence, which allows you to only visit the cells without the corresponding data indicator. Clicking on a cell opens the data entry dialog where you can enter the data values for each trait.
Data input
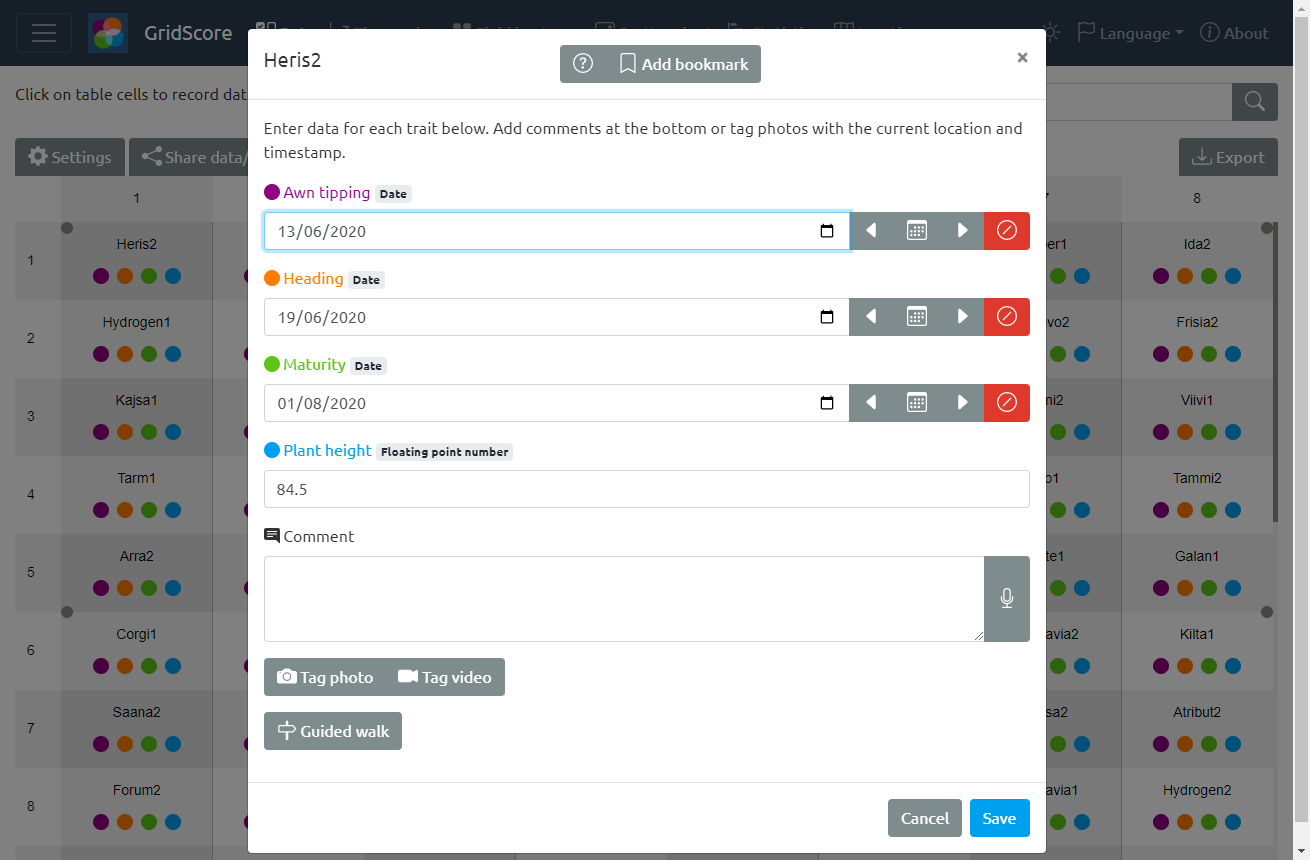
Data is entered for each defined trait using the type-specific input fields. Dates are scored using a calendar or dedicated buttons for previous day, today or next day, numbers using a number input and categories using a dropdown box.
Optionally, comments can be added to data entries. Text-to-speech can also be used for these comments instead of manually typing data into the app.
Guided walk
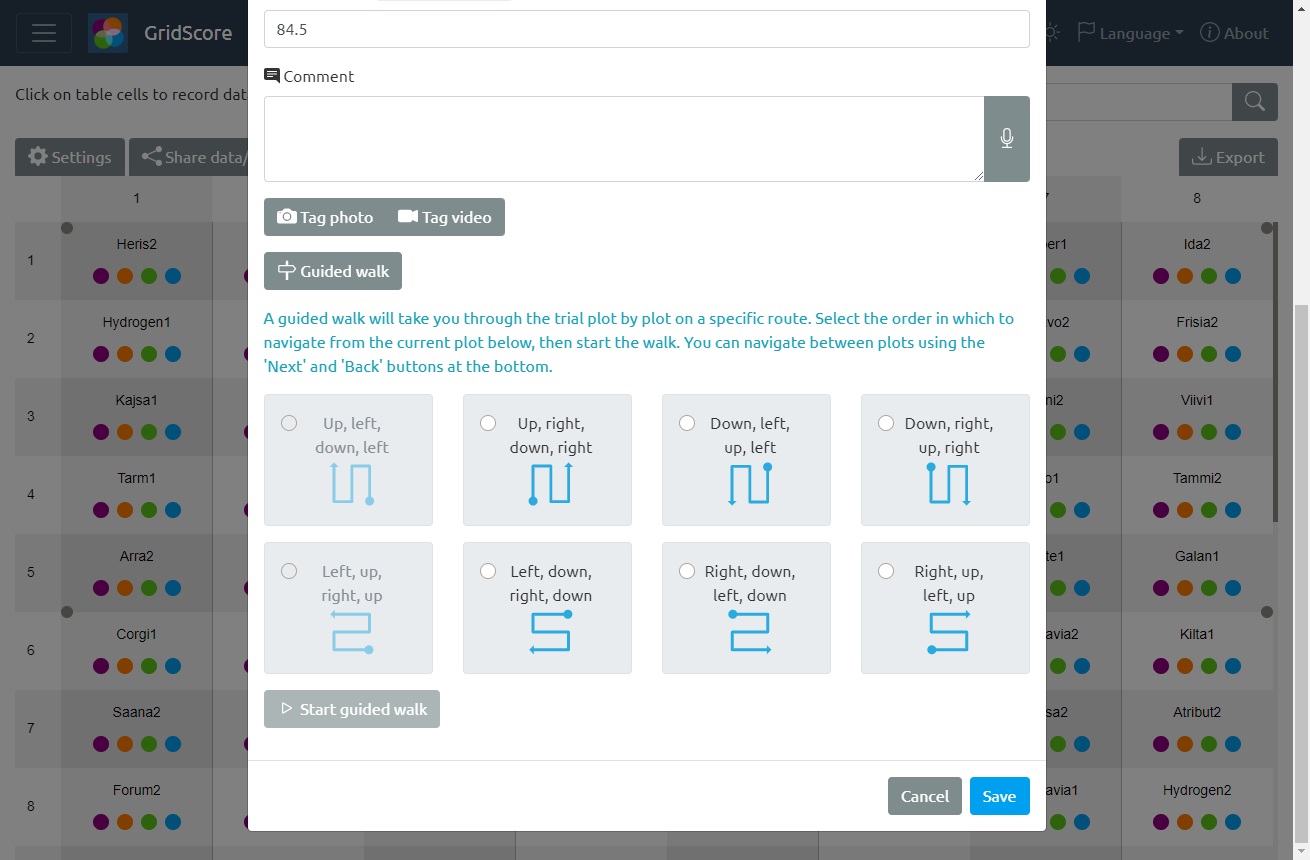
Optionally, you can use the guided walk feature, to let GridScore guide you through the trial one plot at a time. There are 8 walking orders available for you to choose from and they can be started from any plot within the trial.
Image tagging
In addition to the features highlighted above, GridScore can prompt your mobile device to take a photo which will then be tagged with the germplasm/variety name and a timestamp to significantly reduce the amount of effort that has to go into organising your photographs later.
Video tagging
Similar to image tagging, videos can be recorded and stored using the germplasm/variety name and timestamp.